Ask a sales team how much is in the pipeline and you will usually hear the total of every open deal. It is an impressive number and a useless forecast, because it assumes every prospect says yes. Nobody's pipeline works like that.
A weighted pipeline forecast fixes this with one multiplication: each deal counts only in proportion to how likely it is to close. This guide shows the formula, how to choose stage probabilities you can defend, how to read the result, and the pipeline hygiene that keeps it honest. The free Sales Pipeline & Deal Velocity tool calculates it from your deals.
Key takeaways
- Weighted value = deal value × probability of closing. The weighted forecast is the sum over all open deals.
- Base probabilities on the stage a deal has reached, and later on your own win rates.
- A weighted forecast is an average: with only a handful of deals, the real result will land above or below it.
- Stale deals and close dates in the past inflate the forecast. Fix them first.
- Review the pipeline weekly, and move deals by what the buyer has done, not by how the last call felt.
The formula
- Weighted value of a deal = value × probability
- Weighted forecast = the sum of the weighted values of all open deals
- Weighted average probability = weighted forecast ÷ total open value
Won deals are revenue, not forecast, and lost deals count for nothing, so both drop out. In a spreadsheet, with the value in C2 and the probability as a percentage in D2, the weighted value is =C2*D2, and the forecast is the sum of that column.
Choosing stage probabilities
The probability should describe how far the deal has really progressed, so most teams tie it to the stage. A reasonable starting set, which you should replace with your own numbers as soon as you have them:
| Stage | What has happened | Starting probability |
|---|---|---|
| Prospecting | A possible buyer has been identified | 10% |
| Qualified | They have the need, the budget and the authority to buy | 25% |
| Proposal | They have received a priced proposal | 50% |
| Negotiation | They are discussing terms, not whether to buy | 70% |
| Closing | Verbal yes; paperwork in progress | 90% |
Define each stage by something the buyer has done, such as "has received a proposal" or "has sent a purchase order request", rather than by what the salesperson hopes. That one rule removes most of the optimism from a pipeline.
A worked example
A small consultancy has six open deals:
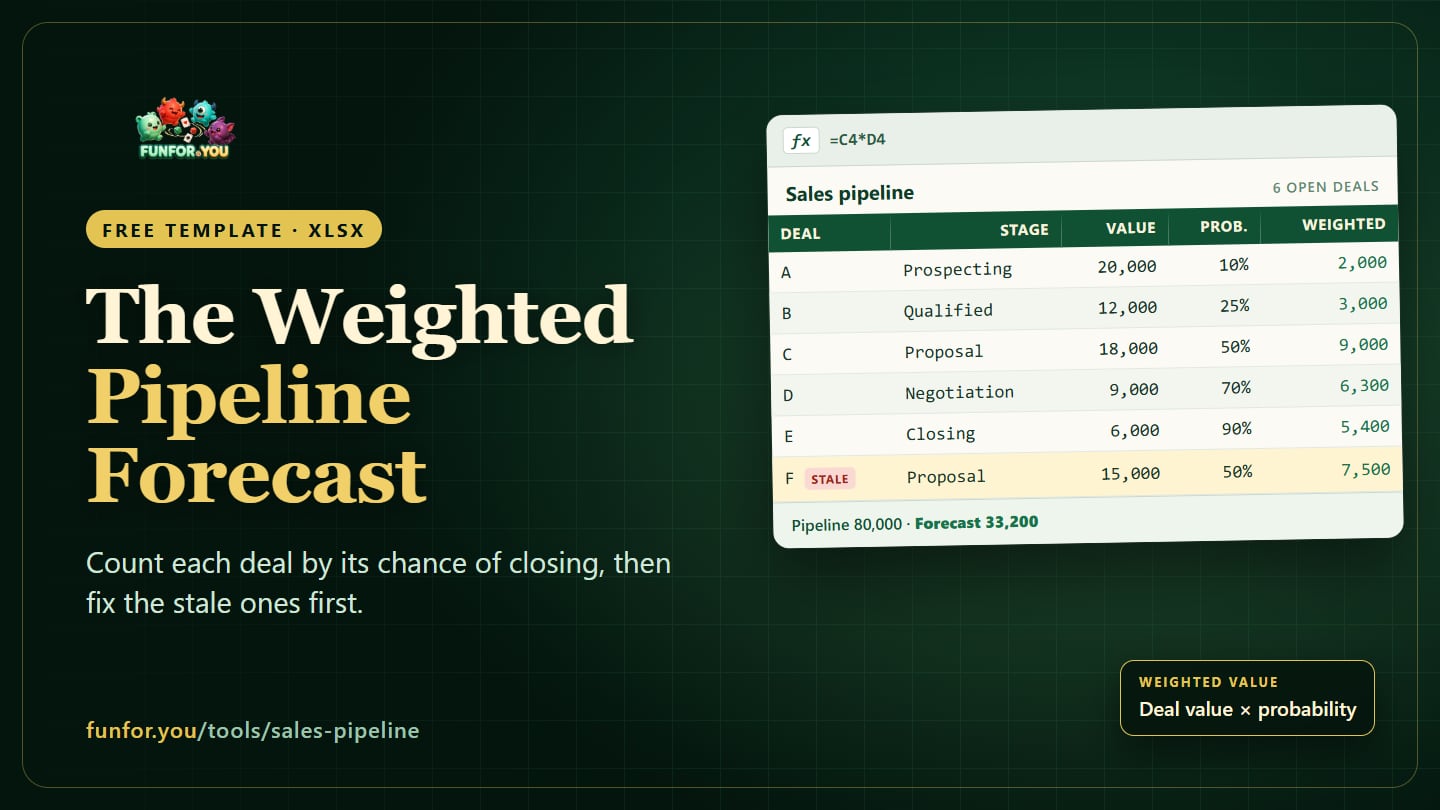
| Deal | Stage | Value | Probability | Weighted |
|---|---|---|---|---|
| A | Prospecting | 20,000 | 10% | 2,000 |
| B | Qualified | 12,000 | 25% | 3,000 |
| C | Proposal | 18,000 | 50% | 9,000 |
| D | Negotiation | 9,000 | 70% | 6,300 |
| E | Closing | 6,000 | 90% | 5,400 |
| F | Proposal | 15,000 | 50% | 7,500 |
| Total | 80,000 | 41.5% | 33,200 |
The pipeline is 80,000, but the forecast is 33,200. That is the number to plan hiring, spending and cash around. Notice that the largest deal, A, contributes the least: 20,000 at prospecting is worth less to a forecast than 6,000 that is nearly signed.
Read it as an average, not a promise
A single deal does not close 50%; it closes or it does not. The weighted forecast is what you would expect on average across many deals like these. With six deals, the real result could easily be 20,000 or 45,000. The forecast becomes more reliable as the number of deals grows, and more fragile when one large deal dominates it.
Two habits help. Look at what is expected to close this month separately from the whole pipeline, because timing matters as much as value. And keep a short "commit" list of deals you would stake your reputation on, alongside the weighted number.
Pipeline hygiene: what quietly inflates the forecast
- Stale deals. No contact for two weeks usually means the deal has cooled, whatever its stage says. In the example, suppose deal F last heard from the client 21 days ago. Dropped back to 25%, its weighted value falls from 7,500 to 3,750, and the forecast to 29,450.
- Close dates in the past. A deal "closing on the 15th" that is still open on the 30th has not closed; either the date or the stage is wrong. Update one of them.
- Probabilities that never move. If a deal has sat at 50% for three months, it is not 50%.
- Deals nobody owns. Every deal needs a name next to it and a next step with a date.
Calibrate with your own win rates
After a few months, replace the starting probabilities with your own history. For each stage, divide the deals that reached that stage and were won by all the deals that reached that stage. If only three of the ten deals that got to proposal were won, your proposal stage is 30%, not 50%, and your forecast should say so.
A weekly pipeline review
- Update the last contact date and next step for every deal.
- Deal with every stale deal: contact it, move it back a stage, or close it as lost.
- Fix every close date in the past.
- Move deals between stages only on buyer actions.
- Read the weighted forecast, and what is expected to close this week and this month.
Build it in the Sales Pipeline tool
The free Sales Pipeline & Deal Velocity tool tracks each deal's company, stage (prospecting through closing, plus won and lost), value, probability, last contact, expected close date, owner and notes. You can type deals in or import a CSV. It then:
- calculates each deal's weighted value, the weighted forecast and the weighted average probability;
- flags deals that need follow-up after seven days without contact, and marks them stale after a limit you set (14 days to begin with);
- sorts close dates into overdue, this week, this month and later, and lists the deals that need action;
- exports an Excel-compatible XLSX with the formulas, and a recap image for a team update.
Everything runs in your browser; nothing is uploaded. Once deals close, the Aged Receivables & Invoice Chaser makes sure the invoices get paid; our guide to the accounts receivable aging report explains how.
Frequently asked questions
What probability should I use for each stage?
Start with a simple ladder such as 10%, 25%, 50%, 70% and 90%, defined by what the buyer has done. After a few months, replace it with your own win rate from each stage.
Is a weighted forecast accurate for a small pipeline?
It is the right average, but with few deals the actual result will vary a lot around it. Look at the biggest deals individually as well.
What is the difference between pipeline value and forecast?
Pipeline value adds up every open deal at full value. The weighted forecast counts each deal by its chance of closing, so it is always lower and far more realistic.
What counts as a stale deal?
A deal with no meaningful contact for longer than your normal sales rhythm. Two weeks is a common limit for short sales cycles; set a longer one if your deals take months.
How often should I update the pipeline?
Weekly. A pipeline updated once a month is mostly history by the time anyone reads it.