
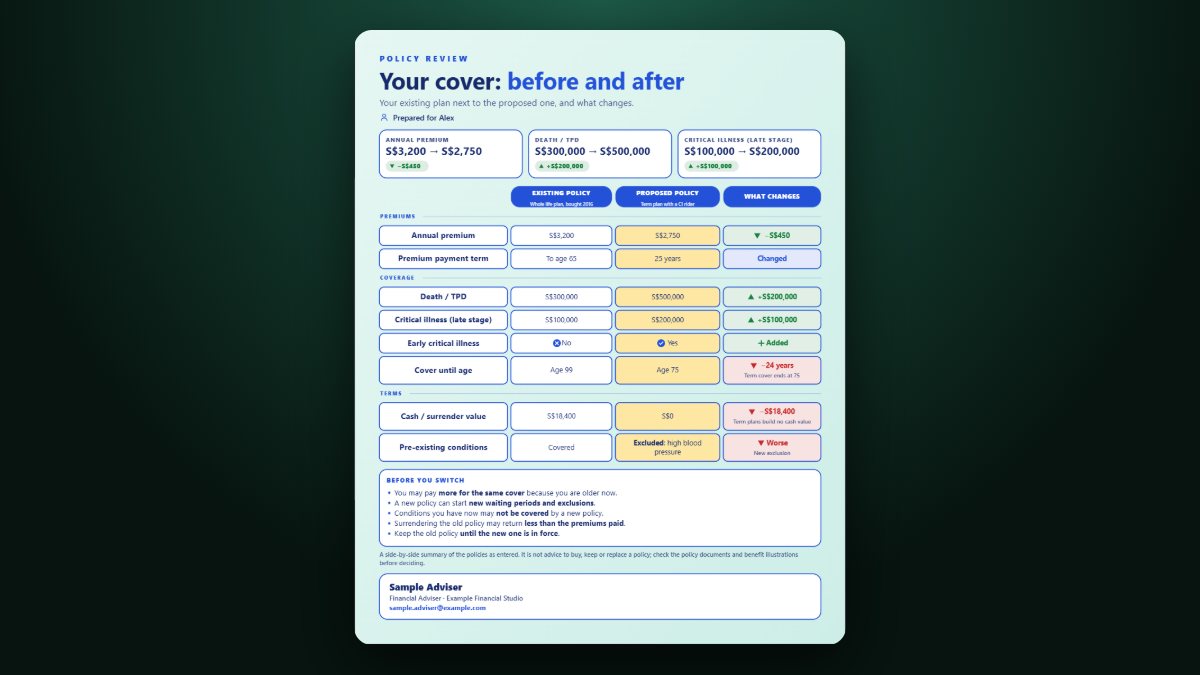
Two insurance quotes can look almost the same: similar premium, similar headline sum assured, similar name. The differences that matter usually sit further down: how long the premium is fixed, what is excluded, when cover stops, and what the riders really add. The only reliable way to see them is to put both policies side by side, line by line, and ask the same question of every row: is this better, worse or the same?
This guide gives you a simple method for doing that, a checklist of the rows worth comparing, and a free Policy Comparison generator that turns the comparison into a clear chart you can share with a client or keep for your own decision.
Key takeaways
- Compare like for like: the same sum assured, the same term and the same person before you compare price.
- Look at total premiums over the whole term, not just the first-year premium.
- Exclusions, waiting periods and when cover ends change the value of a policy more than a small price gap.
- Write every difference as "better", "worse" or "same", so the decision is visible at a glance.
- A comparison helps a conversation; it is not a recommendation. Read each insurer's policy wording before deciding.
Step 1: Make the comparison fair
Most misleading comparisons are unfair before they begin. One quote covers $300,000 to age 65; the other covers $250,000 to age 75. One is for a non-smoker; the other assumed a smoker. Before comparing anything else, align:
- The insured person: same age, gender, smoker status and occupation class.
- The sum assured, or at least note the difference clearly in the first row.
- The coverage term: to a fixed age, for a fixed number of years, or for life.
- The premium term: pay for 10 years, 20 years, or for as long as the cover runs.
If the two quotes cannot be aligned, say so in the comparison itself. "Policy B covers 10 years longer" is a real difference, and it belongs on the chart.
Step 2: Compare the total cost, not the first premium
A lower monthly premium can cost more in total. Work out, for each policy:
- the premium per year;
- how many years you will pay;
- whether the premium is guaranteed, level, or can rise (for example at renewal or at certain ages);
- the total premiums paid over the whole premium term.
Two policies at $1,200 and $1,050 a year look $150 apart. If the first is paid for 20 years and the second for 30, the totals are $24,000 and $31,500, and the "cheaper" one costs $7,500 more.
Step 3: The rows worth comparing
| Row | What to check |
|---|---|
| Sum assured | The main payout, and whether it can increase or decrease over time. |
| What triggers a payout | Death, total and permanent disability, critical illness (which stages?), hospitalisation. |
| Premium and premium term | Per year, total, guaranteed or not. |
| Coverage term | When cover ends. A policy that ends at 65 leaves a gap in later years. |
| Riders | What each one adds, what it costs, and whether it can be removed later. |
| Waiting and survival periods | How long before cover starts for some conditions, and how long you must survive after diagnosis. |
| Exclusions | Pre-existing conditions, specific activities, anything excluded for this person. |
| Cash or surrender value | Whether the policy builds value, and what you would get back if you stopped early. |
| Flexibility | Options to increase cover without new medical checks, premium holidays, conversion options. |
You rarely need every row. Pick the six to ten that matter for this decision and leave the rest in the policy documents.
Step 4: Mark every difference
For each row, write a short verdict: better, worse or same, from the point of view of the person being insured. "Policy B: premium $150 a year lower (better)". "Policy B: cover ends at 65 instead of 75 (worse)". When every row carries a verdict, the overall picture appears by itself, and nobody has to hold ten numbers in their head.
The Policy Comparison generator works out the change on each numeric row for you and marks it better or worse, so you only type the values and the notes.
Step 5: Add the considerations that are not numbers
Some differences do not fit a row: the insurer's claims process, how easy it is to reach the adviser, whether the policy fits other cover the person already has. Add two or three of these as short notes under the table. Keep them factual.
Common mistakes
- Comparing different sums assured and treating the cheaper one as better value.
- Ignoring when cover ends. The years after 65 are often when cover matters most.
- Counting riders twice: including a rider's benefit without including its cost.
- Replacing a policy without checking the loss. Surrendering an existing policy can lose value and cover that a new policy may not replace, especially if health has changed.
Try it free: Enter both policies, choose the rows that matter, and download a clean side-by-side chart with every change marked. Open the Policy Comparison generator on CREATEFOR.YOU. It runs in your browser, needs no sign-up to build and preview, and the entries you type are not sent to the server.
Frequently asked questions
Should I always choose the policy with the lower premium?
No. Compare the total premiums over the whole premium term and what you get for them: the sum assured, the term, the payout triggers and the exclusions. A lower premium with a shorter term or narrower cover can be worse value.
How many rows should a comparison have?
Usually six to ten. Enough to cover cost, cover, term and the main conditions; few enough that the chart can be read in a minute.
Is a side-by-side comparison financial advice?
A comparison records facts about two policies. Whether either is suitable depends on the person's circumstances, which is a matter for a licensed adviser and the insurer's own documents.
Related reading
- Insurance coverage review: how much cover is enough?
- How to explain life, health and critical illness insurance to clients
- Visual recap templates for financial advisers
This article is general information, not financial advice. Policy terms differ between insurers; always read the policy wording and product summary. If you are a representative of a licensed financial adviser or insurer, comparisons you give clients are regulated: use only the comparison formats your firm's compliance team allows.